This post is part of a series on why sometimes we don’t need to pack data in, we need to spread it out. In the previous post I discussed some old-school methods to achieve this. This post talks about a technique that has been available for many Oracle versions so is also pretty old school but I thought it was worth a post all to itself. The technique uses the ALTER TABLE clause “MINIMIZE RECORDS_PER_BLOCK”.
Documentation
MINIMIZE RECORDS_PER_BLOCK
I have included a link to Oracle documentation above but one of the first things to highlight is this feature is light on official documentation. In fact the above page and a brief reference in the SQL Language Quick Reference are just about all there is. Here is a quote from the above link, the emphasis is mine.
“The records_per_block_clause lets you specify whether Oracle Database restricts the number of records that can be stored in a block. This clause ensures that any bitmap indexes subsequently created on the table will be as compressed as possible.”
There is no example in the official documentation but there is a very nice example on Richard Foote’s blog titled “Bitmap Indexes & Minimize Records_Per_Block (Little Wonder)”, and he works for Oracle so perhaps it counts as official documentation!
In the documentation above we have a mention of “restricts the number of records that can be stored in a block” but no clear guidance that it can be used for the reason we desire, to spread out data. If I can’t find what I want in the Oracle documentation my next port of call is My Oracle Support and there is a note describing how we might use this clause for our purpose.
Oracle Performance Diagnostic Guide (OPDG) [ID 390374.1]
In essence the note describes a “hot block” issue and a solution which is to spread data out. Suggested methods are to utilise PCTFREE or the table option, MINIMIZE RECORDS_PER_BLOCK. The note also goes through steps to highlight how to achieve our goal. Which leads us on to the next section.
How To [Mis]use MINIMIZE RECORDS_PER_BLOCK To Spread Out Data
The basic set of steps when using this clause to spread out data is:
- Temporarily remove data from the table, typically with CTAS or Datapump/Export followed by truncate or delete
- Insert the desired number of dummy records any data block should hold
- Restrict the number of records that can be stored in any block to the maximum number currently held
- Delete the dummy rows
- Reinstate the application data
Here is an example.
In the first post in the series I introduced the PROCSTATE table with all rows of data in a single block.
select dbms_rowid.rowid_block_number(rowid) blockno
,      count(*)
from procstate
group by dbms_rowid.rowid_block_number(rowid);

   BLOCKNO   COUNT(*)
---------- ----------
    239004         12
First let’s copy the data elsewhere and truncate the table.
SQL> create table procstate_store
  2  as select * from procstate;

Table created.

SQL> truncate table procstate;

Table truncated.
Next we insert a dummy row and restrict the number of rows any block will hold.
SQL> insert into procstate
  2  select * from procstate_store
  3  where rownum = 1;

1 row created.

SQL> commit;

Commit complete.

SQL> select count(*) from procstate;

  COUNT(*)
----------
         1

SQL> alter table procstate minimize records_per_block;

Table altered.
Finally we delete the dummy row and re-insert the original data.
SQL> truncate table procstate;

Table truncated.

SQL> insert into procstate
  2  select * from procstate_store;

12 rows created.

SQL> commit;

Commit complete.
And we should have only one row per block right? Wrong!
SQL> select dbms_rowid.ROWID_BLOCK_NUMBER(rowid) blockno, count(*)
  2  from procstate group by dbms_rowid.ROWID_BLOCK_NUMBER(rowid);

   BLOCKNO   COUNT(*)
---------- ----------
    278668          2
    278669          2
    278670          2
    278667          2
    278688          2
    278671          2

6 rows selected.
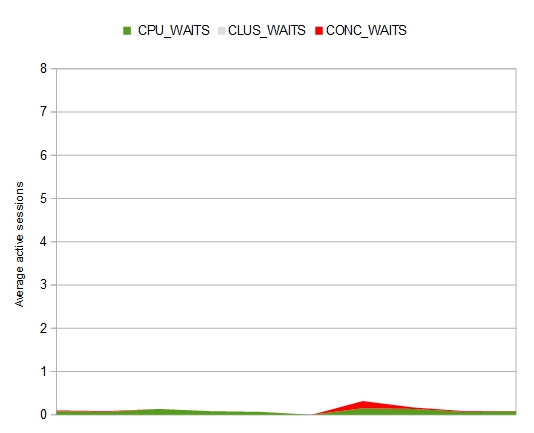
Two rows in each block… but that’s still a good result and using the same test as in the previous post I can see a huge reduction in contention when running my primitive test case. Original results on the left and new results with two rows per block on the right.


Under The Covers
In this section we’ll dig a bit deeper in to how this works and perhaps get some insight into why the example above resulted in two rows per block.
When MINIMIZE RECORDS_PER_BLOCK is used it manipulates a property in SYS.TAB$ in the SPARE1 column. This property is known as the Hakan Factor (no I don’t know why either but I do notice there is a Mr Hakan Jacobsson listed as an author of the Performance Tuning Guide and Data Warehousing Guide… who knows). Below is a query showing the Hakan Factor for a simple table stored in a tablespace using 8KB blocks.
select spare1 from sys.tab$ where obj# = 18013;

    SPARE1
----------
       736
The Hakan Factor is set by default for all heap tables, or more correctly, for all table segments of heap tables. Below is a table showing how it changes as block size changes. It makes sense that larger blocks can hold more rows.
BLOCK_SIZE  SPARE1
----------  ------
       4KB     364
       8KB     736
      16KB    1481
      32KB    2971
After a minimize operation with only a single row in a table it would be reasonable to expect SPARE1 to be set to “1”. So let’s check the value stored after a MINIMIZE operation on the PROCSTATE table.
    SPARE1
----------
     32769
This is because the MINIMIZE operation sets a flag in the 16th bit of the Hakan factor. We can see this using the BITAND SQL function in a query like the one below. This query uses BITAND to check if a specific bit is set in a number. So the increasing powers of 2 have been passed in. I have then used the LEAST() or GREATEST() functions to convert the result to a “1” or “0”.
select spare1
,      least(1,BITAND(spare1,32768)) c32k
,      least(1,BITAND(spare1,16384)) c16k
,      least(1,BITAND(spare1,8192)) c8k
,      least(1,BITAND(spare1,4096)) c4k
,      least(1,BITAND(spare1,2048)) c2k
,      least(1,BITAND(spare1,1024)) c1k
,      least(1,BITAND(spare1,512)) c512
,      least(1,BITAND(spare1,256)) c256
,      least(1,BITAND(spare1,128)) c128
,      least(1,BITAND(spare1,64)) c64
,      least(1,BITAND(spare1,32)) c32
,      least(1,BITAND(spare1,16)) c16
,      least(1,BITAND(spare1,8)) c8
,      least(1,BITAND(spare1,4)) c4
,      least(1,BITAND(spare1,2)) c2
,      greatest(0,BITAND(spare1,1)) c1
from sys.tab$
where obj# = (select obj# from sys.obj$
              where name = 'PROCSTATE');

-- After MINIMIZE with 1 row in PROCSTATE                                 ( decimal 1 )
SPARE1 C32K C16K  C8K  C4K  C2K  C1K C512 C256 C128  C64  C32  C16   C8   C4   C2   C1
------ ---- ---- ---- ---- ---- ---- ---- ---- ---- ---- ---- ---- ---- ---- ---- ----
 32769    1    0    0    0    0    0    0    0    0    0    0    0    0    0    0    1

-- After MINIMIZE with 2 rows in PROCSTATE                                ( decimal 1 )
 32769    1    0    0    0    0    0    0    0    0    0    0    0    0    0    0    1

-- After MINIMIZE with 3 rows in PROCSTATE                                ( decimal 2 )
 32770    1    0    0    0    0    0    0    0    0    0    0    0    0    0    1    0

-- After MINIMIZE with 4 rows in PROCSTATE                                ( decimal 3 )
 32771    1    0    0    0    0    0    0    0    0    0    0    0    0    0    1    1

-- After MINIMIZE with 5 rows in PROCSTATE                                ( decimal 4 )
 32771    1    0    0    0    0    0    0    0    0    0    0    0    0    1    0    0

-- etc etc
Notice the 32K flag is set for all numbers and the lower bits specify the row limit. There is an anomaly for a single row and then the values lag one behind the desired row limit. For example with three rows in the table the Hakan factor has the MINIMIZE flag in the 16th bit and binary “10” (decimal 2) stored. So with a default Hakan factor of 736 the limit is actually set at 737 rows. I can only think that the anomaly where 1 row and 2 rows have the same value stored are down to this feature being in place to optimise bitmap indexes and the difference between one and two rows is irrelevant. Or perhaps storing a zero was ugly and a compromise was made, we’ll never know.
It is worth noting at this point that SPARE1 is a multi use column and a COMPRESS operation will set a flag in the 18th bit. I have not seen a case where the 13th – 15th bits are used. Perhaps they are left for future proofing MINIMIZE from block sizes above 32KB (should Oracle ever decide to implement them). Anyway, back on track…
When “MINIMIZE RECORDS_PER_BLOCK” is executed the Oracle process full scans the table and uses the undocumented SYS_OP_RPB() function to retrieve the row number of every row within its block. e.g.
select max(sys_op_rpb(rowid)) from procstate;
The SYS_OP_RPB() function returns the same result as the documented DBMS_ROWID.ROWID_ROW_NUMBER() function. Output from a table containing four records is below:
select rownum
, dbms_rowid.rowid_relative_fno(rowid) file_no
, dbms_rowid.rowid_block_number(rowid) blk_no
, dbms_rowid.rowid_row_number(rowid) row_no
, sys_op_rpb(rowid) row_rno2
from haktest;

    ROWNUM    FILE_NO     BLK_NO     ROW_NO   ROW_RNO2
---------- ---------- ---------- ---------- ----------
         1         11      18676          0          0
         2         11      18676          1          1
         3         11      18676          2          2
         4         11      18676          3          3
Notice the numbering starts at 0, this explains why the value stored in TAB$.SPARE1 is one less to our eyes than the actual limit. This is true of a block dump too, the numbering of rows in a data block starts at 0.
Finally, to return a table to its default setting the ALTER TABLE NOMINIMIZE clause is used.
Summary
In summary the MINIMIZE clause is not very well documented and definitely not very well exposed in the data dictionary. It is intended for use with bitmap indexes but can be also be used to spread data out in a similar way to PCTFREE but by managing the number of rows rather than amount of free space. I have used MINIMIZE in the past but now that I am older and less excitable I would probably stick to other methods of achieving my goals (e.g. PCTFREE or partitioning).
In the next post in the series we’ll look at some newer ways we can spread out data.