Slow JDBC Connections, STRACE and Random Numbers

I was involved in an interesting problem in the office recently. The problem is already documented in other posts such as:

Oracle 11g JDBC driver hangs blocked by /dev/random – entropy pool empty
Oracle JDBC Intermittent Connection Issue
MOS note “Adbldxml.pl Hangs After Upgrade To 11.2.0.3 (Doc ID 1585759.1)”

Essentially the problem is that /dev/random will block when there is insuffient entropy and JDBC uses /dev/random when negotiating a connection. I’ll not go back over information from the web pages above, please have a quick read of one of them.

What I wanted to do was demonstrate the issue using a Java program from the above MOS note and show evidence of the issue and delays. All the program does is connect to a database using a JDBC thin driver and “SELECT USER FROM dual”, I’ll run it three times as below:

time java oraConn &
time java oraConn &
time java oraConn &

and this is the output (“NJ” is my database account name):

NJ
real    0m2.001s
user    0m1.093s
sys     0m0.094s

NJ
real    0m39.051s
user    0m1.163s
sys     0m0.089s

NJ
real    0m44.316s
user    0m1.162s
sys     0m0.087s

2 seconds for the first connection and 39 and 44 seconds for the others! Not good. We can use “strace” to find out what the processes are doing during these delays.

strace -t -o runjv1.trc -f java oraConn &
strace -t -o runjv2.trc -f java oraConn &
strace -t -o runjv3.trc -f java oraConn &

This is what I see in my strace output for one of the delayed sessions, repeated timeouts, many more than displayed below:

tail -f runjv1.trc
...
2755  21:02:02 futex(0x7f1c440b1054, FUTEX_WAIT_BITSET_PRIVATE, 1, {3390, 520708960}, ffffffff) = -1 ETIMEDOUT (Connection timed out)
2755  21:02:02 futex(0x7f1c440b1028, FUTEX_WAKE_PRIVATE, 1) = 0
2755  21:02:02 futex(0x7f1c440b1054, FUTEX_WAIT_BITSET_PRIVATE, 1, {3390, 571177374}, ffffffff) = -1 ETIMEDOUT (Connection timed out)
2755  21:02:02 futex(0x7f1c440b1028, FUTEX_WAKE_PRIVATE, 1) = 0
2755  21:02:02 futex(0x7f1c440b1054, FUTEX_WAIT_BITSET_PRIVATE, 1, {3390, 621626926}, ffffffff) = -1 ETIMEDOUT (Connection timed out)
2755  21:02:02 futex(0x7f1c440b1028, FUTEX_WAKE_PRIVATE, 1) = 0
2755  21:02:02 futex(0x7f1c440b1054, FUTEX_WAIT_BITSET_PRIVATE, 1, {3390, 672072270}, ffffffff) = -1 ETIMEDOUT (Connection timed out)
2755  21:02:02 futex(0x7f1c440b1028, FUTEX_WAKE_PRIVATE, 1) = 0
2755  21:02:02 futex(0x7f1c440b1054, FUTEX_WAIT_BITSET_PRIVATE, 1, {3390, 722524322}, ffffffff) = -1 ETIMEDOUT (Connection timed out)
2755  21:02:02 futex(0x7f1c440b1028, FUTEX_WAKE_PRIVATE, 1) = 0
2755  21:02:02 futex(0x7f1c440b1054, FUTEX_WAIT_BITSET_PRIVATE, 1, {3390, 772872653}, ffffffff) = -1 ETIMEDOUT (Connection timed out)
2755  21:02:02 futex(0x7f1c440b1028, FUTEX_WAKE_PRIVATE, 1) = 0
2755  21:02:02 futex(0x7f1c440b1054, FUTEX_WAIT_BITSET_PRIVATE, 1, {3390, 823298750}, ffffffff) = -1 ETIMEDOUT (Connection timed out)
...

If I scroll up to the start of the block of timeouts I see this:

2734  21:01:30 read(15,  <unfinished ...>
2755  21:01:30 <... futex resumed> )    = -1 ETIMEDOUT (Connection timed out)
2755  21:01:30 futex(0x7f1c440b1028, FUTEX_WAKE_PRIVATE, 1) = 0
2755  21:01:30 futex(0x7f1c440b1054, FUTEX_WAIT_BITSET_PRIVATE, 1, {3359, 26945244}, ffffffff) = -1 ETIMEDOUT (Connection timed out)

We see the “read” on file descriptor 15 executed by PID 2734 on line 1 above. What are we reading from when reading descriptor 15? Further up the trace file we see:

2734  21:01:30 open("/dev/random", O_RDONLY) = 15
2734  21:01:30 fstat(15, {st_mode=S_IFCHR|0666, st_rdev=makedev(1, 8), ...}) = 0
2734  21:01:30 fcntl(15, F_GETFD)       = 0
2734  21:01:30 fcntl(15, F_SETFD, FD_CLOEXEC) = 0

“/dev/random”! Nice, this agrees with the referenced posts.

We can monitor the available entropy by running this shell snippet during a re-test:

while [ 1 ];do
date
cat /proc/sys/kernel/random/entropy_avail
sleep 1
done

And this is what we see, the available entropy drops causing reads on /dev/random to block. There are a few solutions in the referenced blog and MOS notes.

Wed Aug 19 21:28:07 BST 2015
161
Wed Aug 19 21:28:08 BST 2015
174
Wed Aug 19 21:28:09 BST 2015
134
Wed Aug 19 21:28:10 BST 2015
38
Wed Aug 19 21:28:11 BST 2015
50
Wed Aug 19 21:28:13 BST 2015
61
Wed Aug 19 21:28:14 BST 2015
62
Wed Aug 19 21:28:15 BST 2015
8
Wed Aug 19 21:28:16 BST 2015
21
Wed Aug 19 21:28:17 BST 2015
22
Wed Aug 19 21:28:18 BST 2015
35
Wed Aug 19 21:28:19 BST 2015
37
Wed Aug 19 21:28:20 BST 2015
49
Wed Aug 19 21:28:21 BST 2015
63
Wed Aug 19 21:28:22 BST 2015
0
Wed Aug 19 21:28:23 BST 2015
1
Wed Aug 19 21:28:24 BST 2015
17
Wed Aug 19 21:28:25 BST 2015
36
Wed Aug 19 21:28:26 BST 2015
37

I fully appreciate I am going over work covered by others but I thought the “strace” analysis added to other posts. Also it doesn’t hurt to highlight this issue again as I’m really surprised this is not more widely known as the use of virtual machines is so prevalent these days. I presume connection pools hide this from us most of the time.

Spreading Out Data With MINIMIZE RECORDS_PER_BLOCK

This post is part of a series on why sometimes we don’t need to pack data in, we need to spread it out. In the previous post I discussed some old-school methods to achieve this. This post talks about a technique that has been available for many Oracle versions so is also pretty old school but I thought it was worth a post all to itself. The technique uses the ALTER TABLE clause “MINIMIZE RECORDS_PER_BLOCK”.

Documentation

MINIMIZE RECORDS_PER_BLOCK

I have included a link to Oracle documentation above but one of the first things to highlight is this feature is light on official documentation. In fact the above page and a brief reference in the SQL Language Quick Reference are just about all there is. Here is a quote from the above link, the emphasis is mine.

“The records_per_block_clause lets you specify whether Oracle Database restricts the number of records that can be stored in a block. This clause ensures that any bitmap indexes subsequently created on the table will be as compressed as possible.”

There is no example in the official documentation but there is a very nice example on Richard Foote’s blog titled “Bitmap Indexes & Minimize Records_Per_Block (Little Wonder)”, and he works for Oracle so perhaps it counts as official documentation!

In the documentation above we have a mention of “restricts the number of records that can be stored in a block” but no clear guidance that it can be used for the reason we desire, to spread out data. If I can’t find what I want in the Oracle documentation my next port of call is My Oracle Support and there is a note describing how we might use this clause for our purpose.

Oracle Performance Diagnostic Guide (OPDG) [ID 390374.1]

In essence the note describes a “hot block” issue and a solution which is to spread data out. Suggested methods are to utilise PCTFREE or the table option, MINIMIZE RECORDS_PER_BLOCK. The note also goes through steps to highlight how to achieve our goal. Which leads us on to the next section.

How To [Mis]use MINIMIZE RECORDS_PER_BLOCK To Spread Out Data

The basic set of steps when using this clause to spread out data is:

  1. Temporarily remove data from the table, typically with CTAS or Datapump/Export followed by truncate or delete
  2. Insert the desired number of dummy records any data block should hold
  3. Restrict the number of records that can be stored in any block to the maximum number currently held
  4. Delete the dummy rows
  5. Reinstate the application data

Here is an example.

In the first post in the series I introduced the PROCSTATE table with all rows of data in a single block.

select dbms_rowid.rowid_block_number(rowid) blockno
,      count(*)
from procstate
group by dbms_rowid.rowid_block_number(rowid);
 
   BLOCKNO   COUNT(*)
---------- ----------
    239004         12

First let’s copy the data elsewhere and truncate the table.

SQL> create table procstate_store
  2  as select * from procstate;

Table created.

SQL> truncate table procstate;

Table truncated.

Next we insert a dummy row and restrict the number of rows any block will hold.

SQL> insert into procstate
  2  select * from procstate_store
  3  where rownum = 1;

1 row created.

SQL> commit;

Commit complete.

SQL> select count(*) from procstate;

  COUNT(*)
----------
         1

SQL> alter table procstate minimize records_per_block;

Table altered.

Finally we delete the dummy row and re-insert the original data.

SQL> truncate table procstate;

Table truncated.

SQL> insert into procstate
  2  select * from procstate_store;

12 rows created.

SQL> commit;

Commit complete.

And we should have only one row per block right? Wrong!

SQL> select dbms_rowid.ROWID_BLOCK_NUMBER(rowid) blockno, count(*)
  2  from procstate group by dbms_rowid.ROWID_BLOCK_NUMBER(rowid);

   BLOCKNO   COUNT(*)
---------- ----------
    278668          2
    278669          2
    278670          2
    278667          2
    278688          2
    278671          2

6 rows selected.

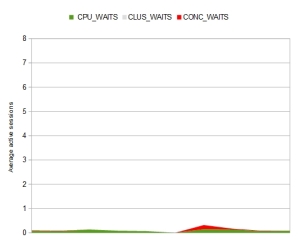
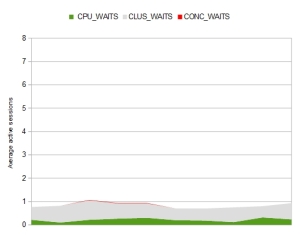
Two rows in each block… but that’s still a good result and using the same test as in the previous post I can see a huge reduction in contention when running my primitive test case. Original results on the left and new results with two rows per block on the right.

Contention  11g normal heap table chart-11g-mrpb

Under The Covers

In this section we’ll dig a bit deeper in to how this works and perhaps get some insight into why the example above resulted in two rows per block.

When MINIMIZE RECORDS_PER_BLOCK is used it manipulates a property in SYS.TAB$ in the SPARE1 column. This property is known as the Hakan Factor (no I don’t know why either but I do notice there is a Mr Hakan Jacobsson listed as an author of the Performance Tuning Guide and Data Warehousing Guide… who knows). Below is a query showing the Hakan Factor for a simple table stored in a tablespace using 8KB blocks.

select spare1 from sys.tab$ where obj# = 18013;

    SPARE1
----------
       736

The Hakan Factor is set by default for all heap tables, or more correctly, for all table segments of heap tables. Below is a table showing how it changes as block size changes. It makes sense that larger blocks can hold more rows.

BLOCK_SIZE  SPARE1
----------  ------
       4KB     364
       8KB     736
      16KB    1481
      32KB    2971

After a minimize operation with only a single row in a table it would be reasonable to expect SPARE1 to be set to “1”. So let’s check the value stored after a MINIMIZE operation on the PROCSTATE table.

    SPARE1
----------
     32769

This is because the MINIMIZE operation sets a flag in the 16th bit of the Hakan factor. We can see this using the BITAND SQL function in a query like the one below. This query uses BITAND to check if a specific bit is set in a number. So the increasing powers of 2 have been passed in. I have then used the LEAST() or GREATEST() functions to convert the result to a “1” or “0”.

select spare1
,      least(1,BITAND(spare1,32768)) c32k
,      least(1,BITAND(spare1,16384)) c16k
,      least(1,BITAND(spare1,8192)) c8k
,      least(1,BITAND(spare1,4096)) c4k
,      least(1,BITAND(spare1,2048)) c2k
,      least(1,BITAND(spare1,1024)) c1k
,      least(1,BITAND(spare1,512)) c512
,      least(1,BITAND(spare1,256)) c256
,      least(1,BITAND(spare1,128)) c128
,      least(1,BITAND(spare1,64)) c64
,      least(1,BITAND(spare1,32)) c32
,      least(1,BITAND(spare1,16)) c16
,      least(1,BITAND(spare1,8)) c8
,      least(1,BITAND(spare1,4)) c4
,      least(1,BITAND(spare1,2)) c2
,      greatest(0,BITAND(spare1,1)) c1
from sys.tab$
where obj# = (select obj# from sys.obj$
              where name = 'PROCSTATE');

-- After MINIMIZE with 1 row in PROCSTATE                                 ( decimal 1 )
SPARE1 C32K C16K  C8K  C4K  C2K  C1K C512 C256 C128  C64  C32  C16   C8   C4   C2   C1
------ ---- ---- ---- ---- ---- ---- ---- ---- ---- ---- ---- ---- ---- ---- ---- ----
 32769    1    0    0    0    0    0    0    0    0    0    0    0    0    0    0    1

-- After MINIMIZE with 2 rows in PROCSTATE                                ( decimal 1 )
 32769    1    0    0    0    0    0    0    0    0    0    0    0    0    0    0    1

-- After MINIMIZE with 3 rows in PROCSTATE                                ( decimal 2 )
 32770    1    0    0    0    0    0    0    0    0    0    0    0    0    0    1    0

-- After MINIMIZE with 4 rows in PROCSTATE                                ( decimal 3 )
 32771    1    0    0    0    0    0    0    0    0    0    0    0    0    0    1    1

-- After MINIMIZE with 5 rows in PROCSTATE                                ( decimal 4 )
 32771    1    0    0    0    0    0    0    0    0    0    0    0    0    1    0    0

-- etc etc

Notice the 32K flag is set for all numbers and the lower bits specify the row limit. There is an anomaly for a single row and then the values lag one behind the desired row limit. For example with three rows in the table the Hakan factor has the MINIMIZE flag in the 16th bit and binary “10” (decimal 2) stored. So with a default Hakan factor of 736 the limit is actually set at 737 rows. I can only think that the anomaly where 1 row and 2 rows have the same value stored are down to this feature being in place to optimise bitmap indexes and the difference between one and two rows is irrelevant. Or perhaps storing a zero was ugly and a compromise was made, we’ll never know.

It is worth noting at this point that SPARE1 is a multi use column and a COMPRESS operation will set a flag in the 18th bit. I have not seen a case where the 13th – 15th bits are used. Perhaps they are left for future proofing MINIMIZE from block sizes above 32KB (should Oracle ever decide to implement them). Anyway, back on track…

When “MINIMIZE RECORDS_PER_BLOCK” is executed the Oracle process full scans the table and uses the undocumented SYS_OP_RPB() function to retrieve the row number of every row within its block. e.g.

select max(sys_op_rpb(rowid)) from procstate;

The SYS_OP_RPB() function returns the same result as the documented DBMS_ROWID.ROWID_ROW_NUMBER() function. Output from a table containing four records is below:

select rownum
, dbms_rowid.rowid_relative_fno(rowid) file_no
, dbms_rowid.rowid_block_number(rowid) blk_no
, dbms_rowid.rowid_row_number(rowid) row_no
, sys_op_rpb(rowid) row_rno2
from haktest;

    ROWNUM    FILE_NO     BLK_NO     ROW_NO   ROW_RNO2
---------- ---------- ---------- ---------- ----------
         1         11      18676          0          0
         2         11      18676          1          1
         3         11      18676          2          2
         4         11      18676          3          3

Notice the numbering starts at 0, this explains why the value stored in TAB$.SPARE1 is one less to our eyes than the actual limit. This is true of a block dump too, the numbering of rows in a data block starts at 0.

Finally, to return a table to its default setting the ALTER TABLE NOMINIMIZE clause is used.

Summary

In summary the MINIMIZE clause is not very well documented and definitely not very well exposed in the data dictionary. It is intended for use with bitmap indexes but can be also be used to spread data out in a similar way to PCTFREE but by managing the number of rows rather than amount of free space. I have used MINIMIZE in the past but now that I am older and less excitable I would probably stick to other methods of achieving my goals (e.g. PCTFREE or partitioning).

In the next post in the series we’ll look at some newer ways we can spread out data.

Spreading Out Data – Old School Methods

In the previous post in this series we introduced a crude test case in which we had data packed in to a single block which was causing severe buffer contention. To re-cap – here is a chart of ASH data demonstrating the issue, the large grey stripe is time wasted on global cache contention.

Contention  11g normal heap table

This post is to cover some “old school” methods that can be used to spread out the data and hopefully reduce contention. I have purposefully ignored the possibility of a design flaw in the code, for the purposes of this series we are assuming the code is in good shape.

Node Affinity

Nothing to do with spreading data out but an obvious remedy for global cache contention by managing where the workload runs. I’m not going to discuss this too much as it doesn’t protect us from “buffer busy waits” within a single instance, however in some cases node affinity would be the correct solution. I have included a chart from the same test case as before but usilising only a single RAC node. You can see that the global cache contention (grey) has gone but we do still have a little “buffer busy wait” contention (red).

Contention 11g nodeaffinity

PCTFREE

Oracle documentation: PCTFREE

This option doesn’t really need any explanation but here we create the test table with the clause “PCTFREE 99” and reload the data.

create table procstate
(    
...
) pctfree 99;

And the data is now spread out.

select dbms_rowid.rowid_block_number(rowid) blockno
, count(*)
from procstate
group by dbms_rowid.rowid_block_number(rowid);

   BLOCKNO   COUNT(*)
---------- ----------
    239021          2
    239040          2
    239022          2
    239020          2
    239019          2
    239023          2

The test case row size is quite small, approximately 0.5% of the free space in a block, so we are left with two rows in each block. Looking at ASH data from the test case shows that contention is much reduced, a nice solution.

Contention 11g pctfree

Single Table Hash Cluster

Oracle documentation: Single Table Hash Cluster

This option didn’t occur to me initially. I tend to avoid Hash Clusters but when I presented on this topic at UKOUG Tech13 a leading light in the Oracle Community suggested this would also be a good solution. So here it is.

The test table has been created in a Hash Cluster stating the size of a cluster of records as 8000 bytes. This is a cheat to ensure each cluster of records ends up in its own block. We are clustering on the primary key column so each block will contain only a single row.

create cluster procstate_cluster
(proc_id number(3)) 
size 8000 single table hashkeys 100;

create table procstate
(
...
,	
)
cluster procstate_cluster(proc_id);

Before loading the data we already have 110 empty blocks. This is because we have configured the cluster to have 100 hash keys and, as stated above, ensured each key maps to a different block. Oracle then rounds up the number of cluster keys to the next prime number (109) and the extra block is the table header.

    BLOCKS
----------
       110

After loading the test data we see there is only a single row in each block.

   BLOCKNO   COUNT(*)
---------- ----------
    172398          1
    172361          1
    239067          1
    172402          1
    172365          1
    239079          1
    172389          1
    172352          1
    239075          1
    172356          1
    239071          1
    172394          1

Running the test case again shows the contention has vanished completely. All sessions spend their time on CPU doing useful work.

Contention 11g Hash Cluster

Another nice if somewhat obscure solution.

Minimize Records Per Block

Speaking of obscure solutions we come to the “MINMIZE RECORDS_PER_BLOCK” clause, we’ll save that for the next installment as I have quite a lot of material to cover.

Sometimes we don’t need to pack data in, we need to spread it out

I’ve gotten away with doing a presentation called “Contentious Small Tables” (download here) for the UKOUG three times now so I think it’s time to retire it from duty and serialise it here.

The planned instalments are below, I’ll change the items to links as the posts are published. The methods discussed in these posts are not exhaustive but hopefully cover most of the useful or interesting options.

  1. Sometimes we don’t need to pack data in, we need to spread it out (this post)
  2. Spreading out data – old school methods
  3. Spreading out data – with minimize records per block (also old school)
  4. Spreading out data – some partitioning methods
  5. Spreading out data – some modern methods

This post is the first instalment.

Sometimes we don’t need to pack data in, we need to spread it out

As data sets continue to grow there is more and more focus on packing data as tightly as we can. For performance reasons there are cases where we DBAs & developers need to turn this on its head and try to spread data out. An example is a small table with frequently updated/locked rows. There is no TX blocking but instead contention on the buffers containing the rows. This contention can manifest itself as “buffer busy waits”, one of the “gc” variants of “buffer busy waits” such as “gc buffer busy acquire” or “gc buffer busy release” or maybe on “latch: cache buffers chains”.

You’ll probably come at a problem of this nature from a session perspective via OEM, ASH data, v$session_event or SQL*Trace data. Taking ASH data as an example you can see below that for my exaggerated test, global cache busy waits dominate the time taken and, key for this series of posts, the “P1” and “P2” columns contain a small number of values.

column event format a35
select * from (
 select NVL(event,'CPU') event
 , count(*) waits
 , p1, p2
 from gv$active_session_history
 where sample_time between 
       to_date(to_char(sysdate,'DD-MON-YYYY')||' &from_time.','DD-MON-YYYY HH24:MI')
   and to_date(to_char(sysdate,'DD-MON-YYYY')||' &to_time.','DD-MON-YYYY HH24:MI')
 and module = 'NJTEST'
 group by NVL(event,'CPU'), p1, p2
 order by 2 desc
) where rownum <= 5;

EVENT                   WAITS    P1      P2
---------------------- ------ ----- -------
gc buffer busy acquire   1012     5  239004
gc buffer busy release    755     5  239004
gc current block busy     373     5  239004
CPU                        65     0       0

For the wait events above “P1” and “P2” have the following meanings:

select distinct parameter1, parameter2
from v$event_name
where name in ('gc buffer busy acquire'
              ,'gc buffer busy release'
              ,'gc current block busy');

PARAMETER1     PARAMETER2
-------------- --------------
file#          block#

So above we have contention on a single buffer. From ASH data we can also get the “SQL_ID” or “CURRENT_OBJ#” in order to identify the problem table. Below we show that all rows in the test table are in a single block – 239004.

select dbms_rowid.rowid_block_number(rowid) blockno
, count(*)
from procstate
group by dbms_rowid.rowid_block_number(rowid);

   BLOCKNO   COUNT(*)
---------- ----------
    239004         12

After discovering this information the first port of call is to look at the SQL statement, execution plan and supporting code but assuming the application is written as best it can be then perhaps it’s time to look at the segment and data organisation.

In order to help illustrate the point of this series here is a chart showing contention in ASH data from a crude test case. The huge grey stripe being “gc” busy waits and the thin red stripe being standard “buffer busy waits”.

Contention  11g normal heap table

The next post in this series will look at some “Old School” methods of reducing this contention.

Listing Top Sessions by CPU in SQL

In the past I’ve considered writing a SQL version of the Unix TOP utility to view busy database sessions. I never got around to it but a recent post by Christian Antognini gave me the inspiration to finally write my script and a few ideas on how best to go about it. Please note my script is purely reporting sessions as a percentage of an instance’s CPU workload – not of a host server’s potential CPU.

The script is below for anyone who may want to give it a try. I’ve included a user to own the code in order to isolate the privileges and make tidying up easy. There are also 2 types to support the PL/SQL code (idea “borrowed” from the post by C.Antognini referenced previously).

CREATE USER dbtop IDENTIFIED BY dbtop ACCOUNT LOCK;
GRANT SELECT ON v_$sesstat TO dbtop;
GRANT SELECT ON v_$sysstat TO dbtop;
GRANT SELECT ON v_$process TO dbtop;
GRANT SELECT ON v_$session TO dbtop;
GRANT EXECUTE ON dbms_lock TO dbtop;

CREATE OR REPLACE TYPE dbtop.top_rec IS OBJECT (
	sid 		NUMBER
,	pid 		VARCHAR2(12)
,	username	VARCHAR2(30)
,	cpu		NUMBER
,	command		VARCHAR2(25)
);
/

CREATE OR REPLACE TYPE dbtop.top_tab AS TABLE OF dbtop.top_rec;
/

CREATE OR REPLACE FUNCTION dbtop.top(	I_loops IN NUMBER DEFAULT 1
				,	I_interval IN NUMBER DEFAULT 5
				,	I_sessions IN NUMBER DEFAULT 10)
	RETURN top_tab PIPELINED
IS
	L_top_tab1	top_tab;
	L_top_tab2	top_tab;

	L_sys_cpu1	NUMBER;
	L_sys_cpu2	NUMBER;
	L_sys_cpu_delta	NUMBER;

	LC_cpu#	CONSTANT NUMBER := 12;

	CURSOR C_top IS
		SELECT 	top_rec(u.sid,p.spid,u.username,s.value
		, 	SUBSTR(u.program,1,25))
		FROM	v$sesstat s
		, 	v$session u
		, 	v$process p
		WHERE	s.statistic# IN (LC_cpu#)
		AND	s.value > 0
		AND	u.sid = s.sid
		AND	p.addr = u.paddr;

	PROCEDURE record_data(O_sys_cpu OUT NUMBER,O_top_tab OUT top_tab)
	IS
	BEGIN
		SELECT	value
		INTO	O_sys_cpu
		FROM	v$sysstat
		WHERE	statistic# = LC_cpu#;

		OPEN C_top;
		FETCH C_top BULK COLLECT INTO O_top_tab;
		CLOSE C_top;
	END record_data;
BEGIN
	-- record first base line of sessions
	record_data(L_sys_cpu1,L_top_tab1);

	FOR L_count IN 1..I_loops LOOP
		dbms_lock.sleep(I_interval);

		record_data(L_sys_cpu2,L_top_tab2);

		L_sys_cpu_delta := L_sys_cpu2 - L_sys_cpu1;

		-- report delta of snapshots. There's a DECODE on sys_cpu 
		-- as my test system has a habit of having 0 cpu!
		FOR R_top IN (
			SELECT	sid,pid,username,cpu_perc,command
			FROM	(
				SELECT	t2.sid,t2.pid,t2.username
				,	DECODE(L_sys_cpu_delta,0,0,ROUND(((t2.cpu - t1.cpu)
						/ L_sys_cpu_delta)*100,2)) cpu_perc
				,	t2.command
				FROM	TABLE(L_top_tab1) t1
				,	TABLE(L_top_tab2) t2
				WHERE	t1.sid (+) = t2.sid
				ORDER BY cpu_perc DESC
			)
			WHERE ROWNUM <= I_sessions
		) LOOP
			PIPE ROW(top_rec(R_top.sid
				,	R_top.pid
				,	R_top.username
				,	R_top.cpu_perc
				,	R_top.command));
		END LOOP;

		PIPE ROW(top_rec(NULL,NULL,NULL,NULL,NULL));

		L_top_tab1 := L_top_tab2;
		L_sys_cpu1 := L_sys_cpu2;
	END LOOP;
END top;
/

Below is an example of how to run the code (note I’ve again borrowed from Mr Antognini’s post with my ARRAYSIZE setting).

SET ARRAYSIZE 1
COLUMN username FORMAT a15
SELECT sid, pid, username, cpu, command FROM table(dbtop.top(2));

       SID PID          USERNAME               CPU COMMAND
---------- ------------ --------------- ---------- -------------------------
       159 28484        SYS                  98.36 sqlplus@localhost.localdo
       142 28487        OPS$NEIL              1.64 sqlplus@localhost.localdo
       147 3968                                  0 oracle@localhost.localdom
       161 3937                                  0 oracle@localhost.localdom
       163 3933                                  0 oracle@localhost.localdom
       165 3929                                  0 oracle@localhost.localdom
       164 3931                                  0 oracle@localhost.localdom
       162 3935                                  0 oracle@localhost.localdom
       160 3939                                  0 oracle@localhost.localdom
       153 3953                                  0 oracle@localhost.localdom

       159 28484        SYS                  98.21 sqlplus@localhost.localdo
       142 28487        OPS$NEIL              1.79 sqlplus@localhost.localdo
       147 3968                                  0 oracle@localhost.localdom
       161 3937                                  0 oracle@localhost.localdom
       163 3933                                  0 oracle@localhost.localdom
       165 3929                                  0 oracle@localhost.localdom
       164 3931                                  0 oracle@localhost.localdom
       162 3935                                  0 oracle@localhost.localdom
       160 3939                                  0 oracle@localhost.localdom
       153 3953                                  0 oracle@localhost.localdom

The SYS session above is a count of records in DBA_EXTENTS by the way. Session 149 is TOP itself.